")
“Mathematics is the Language of Nature.” [Galileo] The real beauty of Mathematics lies in its ability to be deterministic and not just predict coincidences! This ability to predict the outcomes beforehand provided Humans a certain sense of power over nature. Yet when a simple deterministic non-linear equation spiraled into chaos, the whole system of beliefs crumbled as minds collapsed into madness. It was no logical fallacy, but Nature’s way of unfolding the mysteriousness that lies beyond human comprehension; ‘The Logistic Map Equation!’
This equation not only sparked debates but its appearance over a broad range of fields that aren’t even sparingly related startled mathematicians. The equation popped up at so many places, that it began to appear spooky just as the “Fine Structure Constant.” Let’s examine the chaos, shall we?!
A Mathematical Coincidence
The Logistic Map equation first gained popularity when it was introduced in 1976 in a paper published by Biologist Robert May. The purpose was to create a demographic model that would depict the rise and fall of the population and predict future population values. Mathematically, it’s written as:
xn+1=rxn(1-xn)
where xn is a number between (0,1] that represents the ratio of existing population to Tmax. possible population. The parameter ‘r’ dubbed as ‘Growth Rate’ lies in an interval of [0,4].
The equation may not sound so familiar but its graphical representation captures fascination but at the same time is mysterious. The Cobweb Plot presented in below video depicts qualitative behavior of One-dimensional iterated Logistic Map function, meaning it shows long term status of initial conditions when reiterated over and over.
Let’s start with the population of rabbits, a group of rather active bunnies! Assuming that bunnies die due to starvation only and not any other natural or artificial cause. We will start with a value of xn ≈ 70% and growth rate as r=1.75, plotting a graph of population vs time, after many reiterations, we notice that population stabilizes at a certain value of xn+1 ≈ 0.4285714 called “The Theoretical Maximum.” The maximum indicates that the environment can support only this population with a margin of only 1% error (Give or Take!).
Well, this is just the tip of the iceberg, if we vary the Growth rate keeping the initial population constant, the Bifurcation diagram which is expected to be normal, that graph went crazy from 0-100 real quick!
The main remarks observed here are:
- When r is in the range [0,1], the population will die, independent of the initial population.
- When r is in range (1,2), the population will quickly approach the value (r-1)/r, independent of the value of the initial population.
- When r is in the range [2,2.95), the population will approach the value (r-1)/r but will fluctuate around that value for some time.
- When r is in the range [2.95,3.44] the graph splits exactly into 2, the population will permanently oscillate between these two values.
- After r falls in range (3.44,3.54) the graph splits into 4, and the population will permanently oscillate between four values.
- After r > 3.54409 the population oscillates with a period of 8 (r=3.55), then 16 (r=3.588), 32, etc… and just when r approaches 3.59995, boom CHAOS!! There’s no cycle here no pattern just random numbers with no relation other than the equation.
The Bifurcation graph falls in the category of ‘Period-Doubling Bifurcations-Z’ since the periods change with varying values of ‘r’. The chaotic behavior provided the first-ever method to generate pseudo-random numbers from a deterministic machine. It’s pseudo because if you knew the initial values, you can calculate the number.
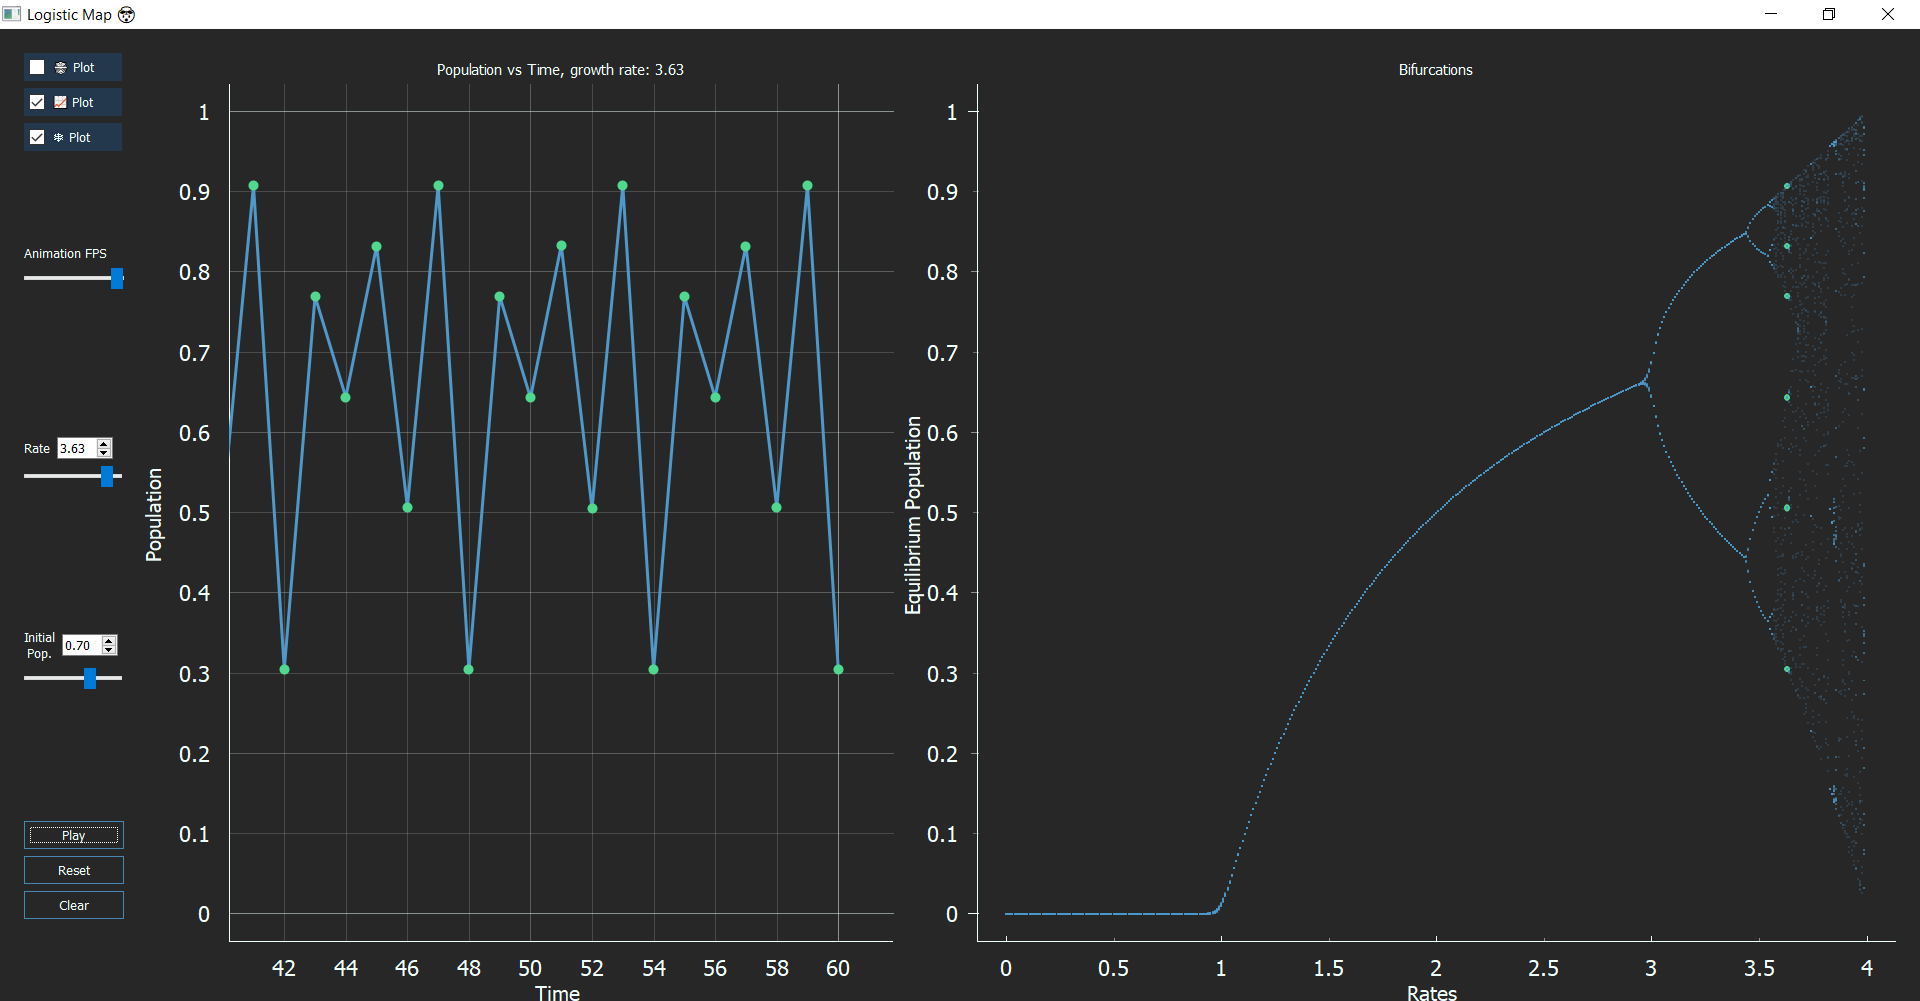
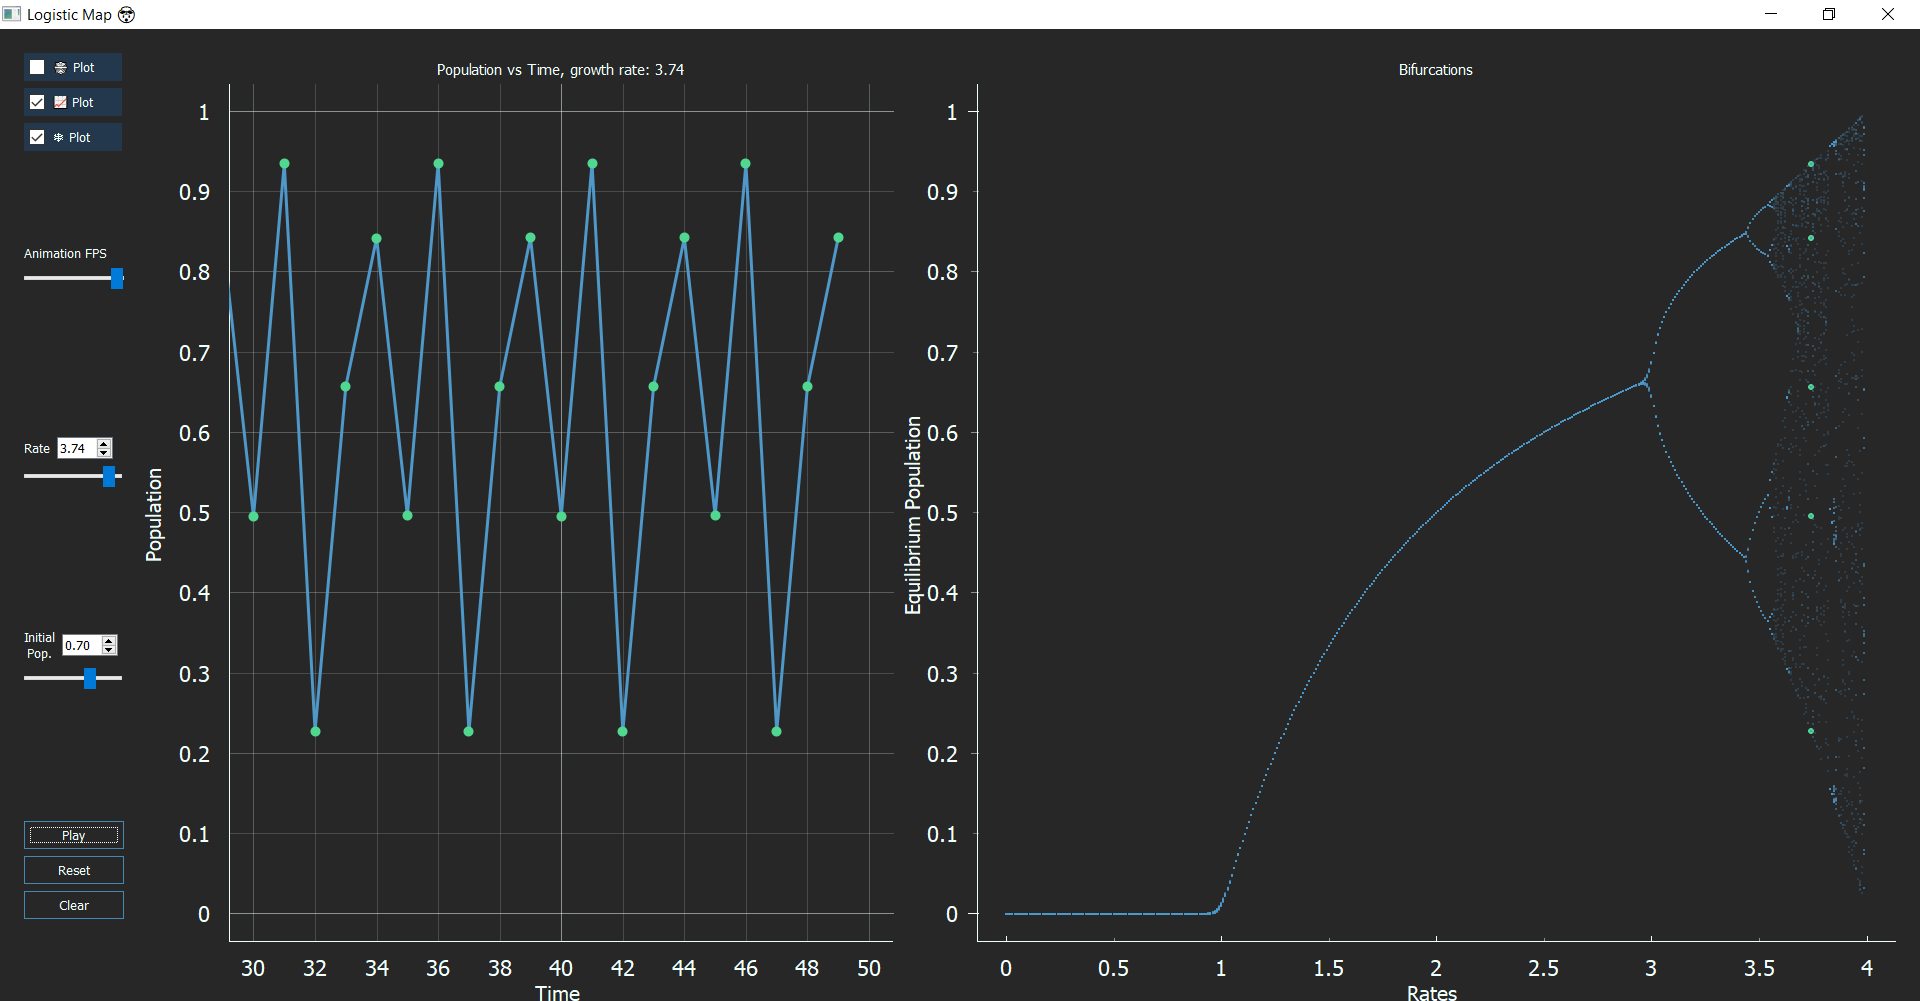
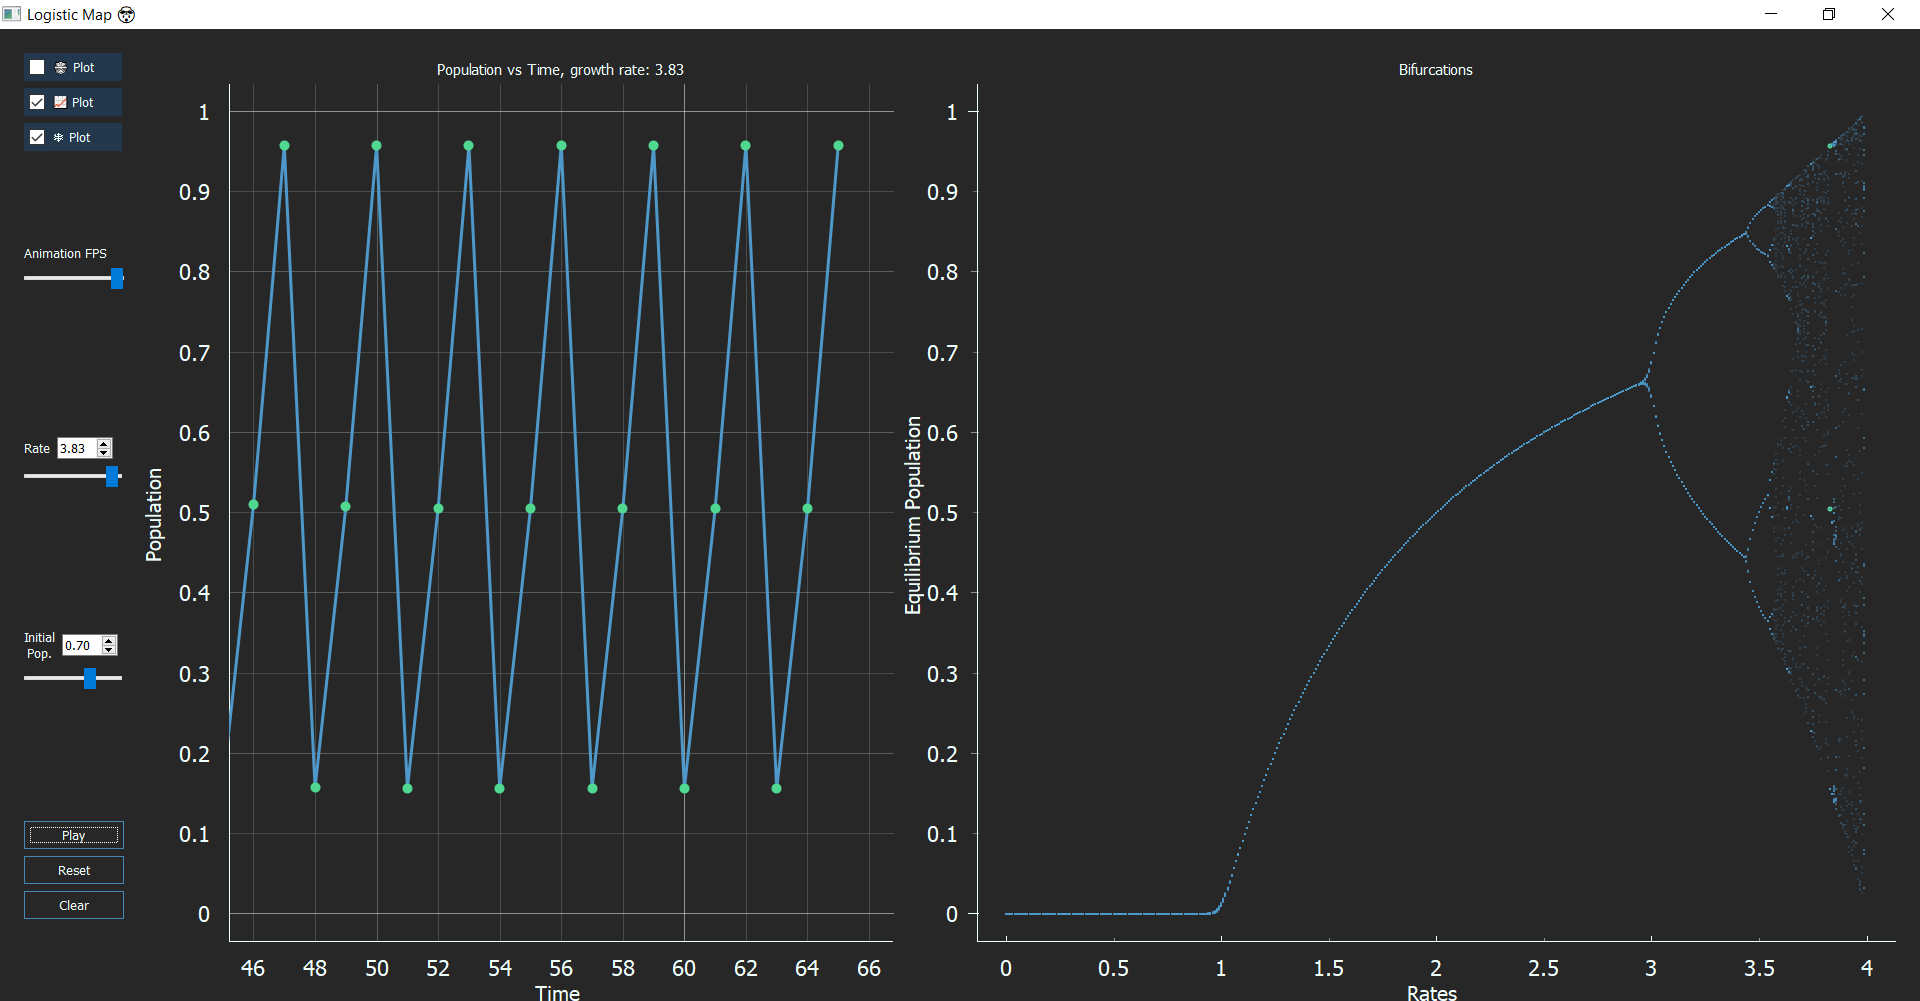
Now, if your observation skills are as polished as Sherlock, you might notice some gaps in the Bifurcation graph. These regions that exist between chaos are called “Windows/Islands of Stability.” These windows come in any period you want like 5, 6, 12, any number you just need the right value of ‘r’. At r = 3.63, the period is 6, or r = 3.74, the period is 5 and at r = 3.83 period is 3. This type of behavior is termed as ‘Pomeau-Mannville Scenario’ characterized by periodic phases with bursts of aperiodic behavior.
Windows Of Stability
Experimental Evidence of Logistic Map Equation
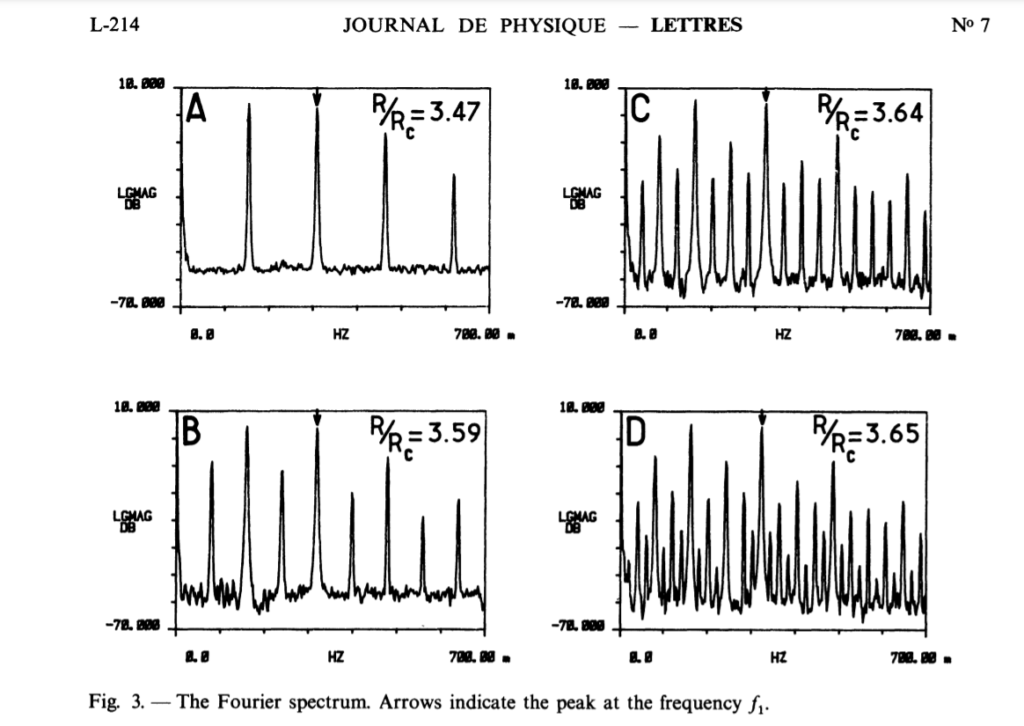
The mathematicians after discovering this chaotic scenario went blank with no explanation like they had hit the wall! With no light in sight, they decided to this experimentally. Now, controlling the ‘Growth rate or Breeding rate’ of a population was something they couldn’t afford, therefore Fluid mechanics came into the picture. The Fluid dynamicist “Libchaber A.” published a paper in which he created a sort of Schrodinger’s box with two-counter rotating cylinders containing mercury. He used a small Temperature gradient, and he measured the temperature using a probe at the top. So far, all good, but when he tried increasing the Temperature gradient, at some point he noticed that the values oscillated permanently with a period of Two. Then he got a period of 4, 8, and after some point he encountered Chaos.
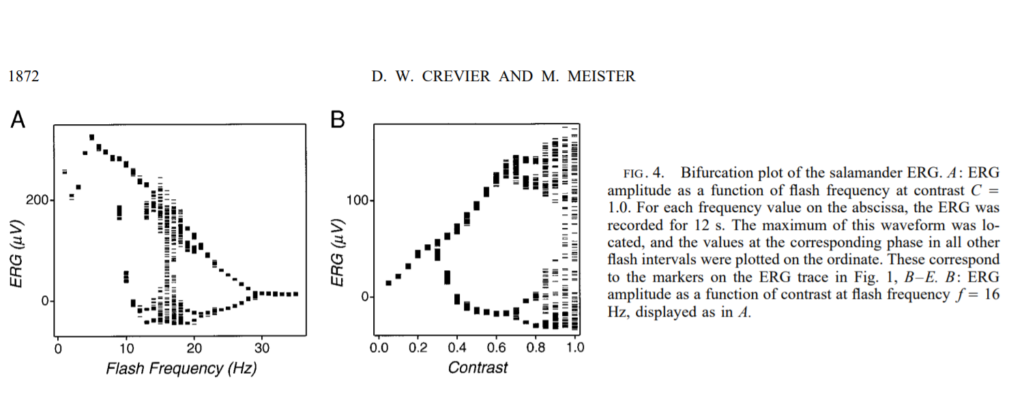
This was not the only experimental evidence, two biologists in 1872 published research where they compared the blinking of the human eye to that of a salamander’s (Idk, what inspired them!). What they found was when the frequency of light hits a certain point, our eyes only respond to alternate flickers, meaning a period of Two. The plot of Flickering vs Frequency followed the whole Bifurcation diagram, which showed that the Equation is capable of predicting the Neural Firing pattern up to a specific point.
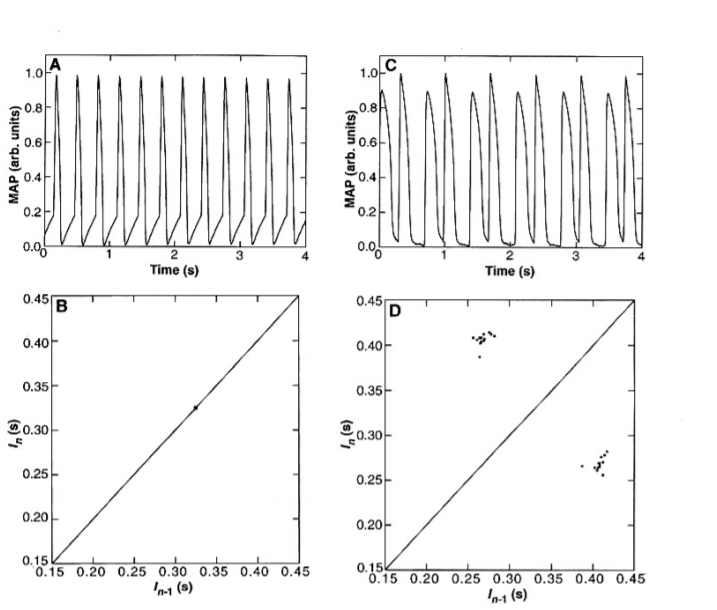
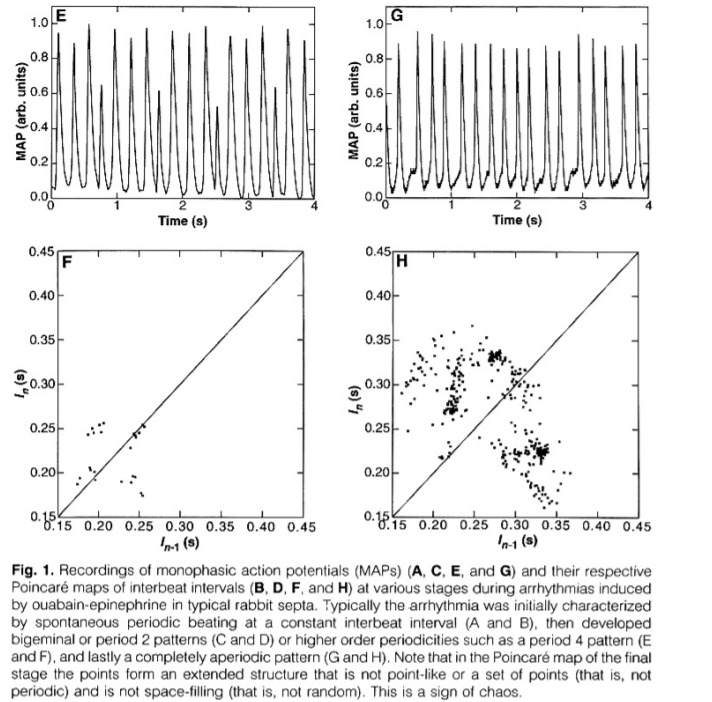
Like if all this was not astounding for you, the human heart followed the dynamics of this equation too! In another study conducted in 1992, scientists gave rabbits a drug that made their hearts go into Fibrillation (Don’t know what’s the deal between scientists and rabbits!), a condition where your heart beats in such an asymmetric way that it’s really not pumping any blood, and if not cured fast, you won’t last! They found the Period-doubling route to chaos. Rabbits started at periodic beats, after time the period doubled, then quadrupled, and finally, the beats reached the state of mayhem. Amazingly, the scientists knew that there were ‘Windows of stability amid the frenzy, and they calculated the exact conditions of when to apply electrical shocks to return it to periodicity. So they used something like Chaos to control a Systematic Entity, that’s really beautiful!
The Feigenbaum Constant And Equation-Universality

Now a physicist called “Mitchell Feigenbaum” thought he would take a shot at the Logistic Map! He observed when the bifurcations occur, and then he divided the width of each bifurcation section by the next one! He discovered that the ratio closed in on a value of “4.669.” This constant was not related to any fundamental discovered constant, so it was coined as ‘Fiegenbaum’ Constant.’ What he had discovered was true universality. Not only Logistic Map Equation but any other single hump function reiterated would follow the same dynamics as this.
The theory of Universality springing from the onset of Chaos tells us that simple functions and models that are deemed to be predictable hold fragments of Uncertainty, fragments that resemble torns in the upholstery of theories, theories that are nothing but revelations of Consciousness from a mere Coincidence.
You can try the code for interactives yourself. Here’s the GitHub link. Interactives and codes by Johnny Hyman.
This site was… how do I say it? Relevant!! Finally I’ve found something that helped me.
Appreciate it!
Very nice post. I just stumbled upon your blog and wanted to say that
I have really enjoyed browsing your blog posts. After all
I will be subscribing to your feed and I hope you write again very soon!